By: Buzzocles
Editor’s Note – This is a follow up to Buzzocles’ Comprehensive Analysis of Commodity Prices and the Economy. Link below – JT)
Prefix: The Commodity Conflation Fallacy
True market pricing is never the product of an isolated metric. To view silver purely through the lens of COMEX draw downs is a fundamental analytical error. Commodities operate within a synergistic matrix of geopolitical friction, monetary debasement, and physical constraints. The depletion of the Strategic Petroleum Reserve (SPR) will, alongside concurrent factors, stimulate cost-push inflation in an economy already suffocating under a $40+ trillion sovereign debt wall. It is a wall because at this level the Federal Reserve has little recourse to its traditional monetary tools. Capital may flee to preserve value, seeking perhaps to transition to silver, but in this case it will collide with an inelastic industrial floor that cannot substitute its inputs. The resulting price rise will not be caused by one variable, but by the simultaneous confluence of many.
This week’s audit updates and builds upon the November 1 Sunday Audit. It is a bit ‘light’ because there appears to be imminent escalation of the Gulf War this evening, and we are busy completing Part 2 of last week’s report on ‘Road Maps.’ cbnc.com/silver-price-increase-paper-market-fracture-conditions/
Table 1: Macro Indicator Matrix (Current as of November 15, 2026)
| Variable | Magnitude (Nov 15, 2026) | Rate of Change (vs. Nov 1 Audit) | Current Market Context |
| Silver Spot Price | $47.49 – $49.82 / troy oz | -$0.78 to -$3.11 (Down ~1.5% to 6.1%) | Broke below the $50 psychological floor again mid-November amid USD strength and expectations for a December Fed rate hike. |
| COMEX Registered Float | 101.72M ounces | -2.58M ounces (-2.5%) | Deliverable inventory edged lower over the two-week window (down 1.3% over the trailing 30 days), representing 30.6% of total COMEX vault stocks. |
| U.S. Strategic Petroleum Reserve (SPR) | 279.54M barrels | -3.36M to -5.06M barrels | Continued drawing down in early November (falling 2.65M barrels in the week ending Nov 6 alone) to a fresh 44-year low. |
| National Average Retail Diesel | $6.02 / gallon | -$0.33 / gallon (-5.2%) | Eased off early-November highs alongside crude oil’s pullback, though still up $2.25/gal (+59.7%) compared to November 2025. |
| Physical Oil (Dated Brent) | $94.74 – $95.84 / barrel | -$16.00 to -$17.10 (-14.3% to -15.3%) | Retreated sharply from the $111.84 level on Nov 2 as Middle East export flows recovered and risk premiums cooled. |
| U.S. Sovereign Debt | $40.55 – $40.60 Trillion | +$110B to +$160B | Gross public debt crossed $40.55T in early November, with annualized interest outlays reaching a record $1.33 trillion. |
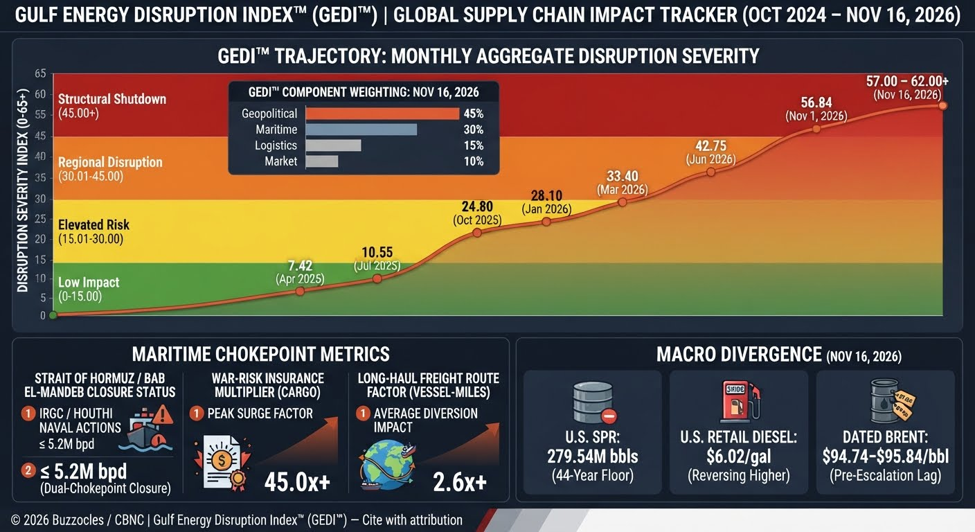
| Gulf Energy Disruption Index (GEDI) | 57- 62 (New Historic High) | Surging above Nov 1 peak | Reverses early-November transit recovery and threatening immediate upward reversal in Dated Brent and diesel. |
Silver, Fiscal Dominance, and the Informational Lag
As stated two weeks ago, the global financial architecture is currently operating under a profound informational lag, where public-facing narratives are deliberately utilized to compress sentiment and mask structural insolvency. For the analytical observer, this creates a profound opportunity: a clear divergence between institutional signaling and physical reality.
Bifurcated Postures…
The clearest manifestation of this informational lag lies in the split posture of the world’s dominant bullion bank. J.P. Morgan Global Research has slashed its Q4 2026 silver target to $63 per ounce (with a $70.60 annual average), citing rising Federal Reserve rate expectations and a projected 30% (60 million ounce) drop in solar-application demand—a forecast built on the same lab-scale thrifting assumptions commercial manufacturers have yet to achieve. In its November 9 metals briefing, the bank’s research desk further emphasized that speculative paper positioning had “turned light“.
Yet while its public research desk projects subdued prices and light paper positioning, J.P. Morgan’s COMEX depository continues to sit at the center of global physical bullion storage—housing roughly 195 to 210 million ounces of silver across registered and eligible vaults (roughly a quarter of annual global mine output) on behalf of institutional clients, ETFs, and commercial accounts, even as J.P. Morgan Securities actively takes physical delivery of metal (‘stopping’ delivery notices) on COMEX. This divergence underscores a recurring structural divide: cautious public price targets and washed-out paper sentiment on one side, while vast physical reserves remain locked inside institutional vault infrastructure on the other. For what it’s worth, that revised “bearish” Q4 target of $63 per ounce is still roughly 25% to 30% higher than current spot pricing ($47.49 to $49.82 per ounce).
Industrial Demand
Industrial demand remains structurally resilient, anchored by the rapid buildout of hyperscale AI data centers, electrical grid interconnects, and commercial manufacturing bottlenecks in solar panel thrifting. Mainstream bear models projecting a steep collapse in photovoltaic silver consumption routinely commit the same analytical error—extrapolating controlled laboratory thrifting prototypes from institutes like Fraunhofer ISE and UNSW onto gigawatt-scale commercial assembly lines that cannot replicate them without catastrophic yield and warranty failures. In real-world mass production, pushing silver paste below roughly 5 to 7 mg per watt introduces elevated series resistance, localized hot-spotting, and contact delamination across multi-decade thermal cycles. At the same time, alternative copper-metallization processes require heavy capital retooling and continue to face oxidation and long-term adhesion risks. With manufacturers unable to aggressively substitute or thrift away silver without risking costly product liability claims—and with AI data-center power infrastructure adding fresh non-substitutable electrical demand—commercial procurement remains highly price-inelastic.
U.S. Sovereign Debt and the GEDI
With U.S. sovereign debt reaching $40.55 to $40.60 trillion and annualized interest outlays hitting a record $1.33 trillion (consuming roughly 22% to 24% of federal revenues), foreign central bank bidding has dropped to 52.5% while domestic buyers have had to absorb 30.7%. Simultaneously, the Gulf Energy Disruption Index (GEDI) has surged to a new historic high of 57.00 – 62.00+ following Iran’s declaration that the Strait of Hormuz is closed, the Houthi seizure of the Bab el-Mandeb coast, and the convergence of three U.S. carrier strike groups off Iran. The dual-chokepoint lockout traps Middle Eastern distillate flows and severs the Red Sea bypass, threatening to immediately reverse retail diesel’s brief pullback to $6.00 – $6.04 per gallon—especially with Russian relief cargoes legally blocked from U.S. ports and European buyers forced to bid up U.S. Gulf Coast supply. As distillate crack spreads and war-risk freight premiums re price higher, energy-driven cost pressures are set to accelerate across the broader economy, including energy-intensive mining operations.
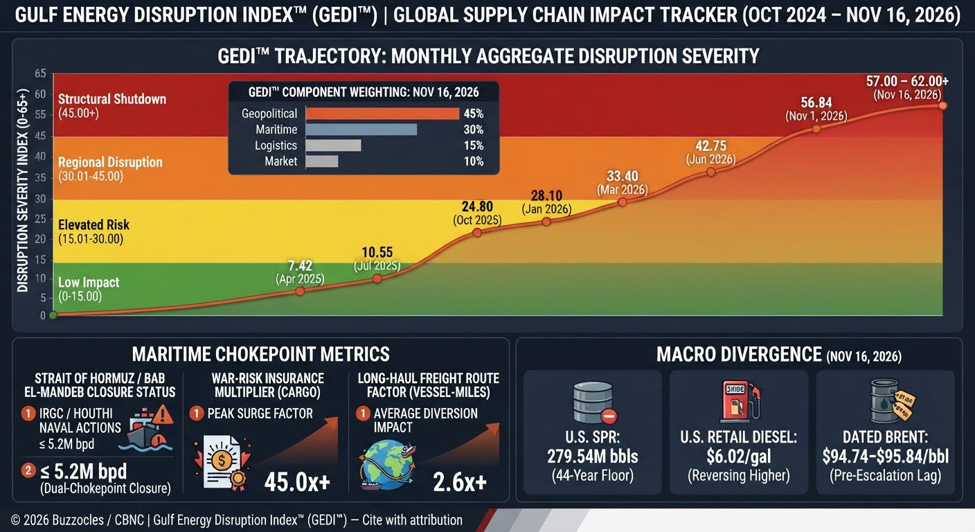
Table 2: 24-Month GEDI Trajectory Log
| Reporting Period | Daily Transit Crossing Volume (Strait of Hormuz) | War Risk Insurance Premium Multiplier | Calculated GEDI Print |
| Oct 2024 (Base) | 18.5M bpd (Normal baseline) | 1.0x (Standard baseline) | 1.00 (Normalized Regime) |
| Apr 2025 | 16.2M bpd (Initial Friction) | 3.5x (Escalation premium) | 7.42 (Elevated Alert) |
| Oct 2025 | 12.1M bpd (Active Kinetic Interdiction) | 12.0x (Prohibitive parameters) | 24.80 (High Disruption) |
| Mid-Oct 2026 | 11.1M bpd (Temporary protection rebound) | 30.0x (Commercial paralysis) | 42.19 (Critical Baseline) |
| Nov 1, 2026 | 5.2M bpd (Immediate structural shutdown) | 45.0x (Terminal war-risk loading) | 56.84 (Previous High ) |
| Nov 15, 2026 | <=5.2M bpd (Shutdown. Hormuz declared “closed” by IRGC; Bab el-Mandeb falls) | 45.0x (Terminal war-risk loading) | 57 – 62 (New High ) |
Asian Arbitrage What Changed Between November 1 and November 15, 2026
Shanghai vs. Western Silver Premium: The extreme 12% to 17% Shanghai premium cited in the November 1 draft has compressed as Western paper prices pulled back toward ~$48–$50/oz and Shanghai Futures Exchange (SHFE) prices adjusted alongside them. Today (mid-November 2026), SHFE silver is trading around 12,350–12,500 RMB/kg (roughly $53.50–$54.50/oz), maintaining a sustained ~7% to 11% structural premium ($4.00–$5.50/oz) over COMEX spot/futures—still high enough to incentivize continuous eastward physical arbitrage, without overstating the spread.
Chinese Import Surge: China’s official customs data for September/October 2026 confirmed unwrought silver imports surged +75% to +173% year-over-year depending on the monthly comparison window (with Q3/early-Q4 inflows running sharply above multi-year seasonal averages as domestic industrial/solar fabricators and SHFE warehouses rebuilt depleted stocks).
Result: The sustained East-West spread continues to pull physical metal out of Western vaults ahead of the active December 2026 COMEX delivery cycle. With First Notice Day arriving on November 30, December open interest still stands at over 400 million paper ounces against a dwindling COMEX registered float of just 101.72 million ounces—a nearly 4-to-1 paper-to-registered overhang. While the vast majority of futures contracts routinely roll forward into March prior to delivery, an overhang of that size leaves little room for error: if even a modest fraction of remaining long holders opt to stand for physical metal rather than roll, deliverable vault liquidity would face immediate strain.
Why Oil Has Not Spiked on Tonight’s War Headlines Yet
Despite Iran’s IRGC declaring the Strait of Hormuz “closed” and Houthi forces capturing the Bab el-Mandeb coast, paper crude futures are currently pinning near $95/bbl because traders are weighing those weekend strikes against the International Energy Agency’s (IEA) November 13th forecast (November 2026 Oil Market Report) projecting a 1.7 million bpd global supply surplus in Q4 2026—creating the exact same paper-vs.-physical lag we have highlighted in previous reports.
Observations and Conclusion
The defining feature of the market entering Monday morning is not a lack of bullish catalysts—it is a dangerous lag between backward-looking paper models and real-time physical reality. Across both energy and precious metals, institutional pricing is currently anchored to stale assumptions: crude traders are leaning on a Friday IEA surplus forecast built on October dark-fleet transits that Sunday night’s dual-chokepoint closure of Hormuz and Bab el-Mandeb just invalidated, while COMEX silver algorithms remain fixated on marginal Federal Reserve rate rhetoric even with speculative positioning already washed out.
That disconnect faces an imminent calendar test. In two weeks, the December 2026 COMEX silver contract hits First Notice Day on November 30, with current open interest still exceeding 400 million paper ounces against just 101.72 million ounces of deliverable registered stock. While the vast majority of futures contracts routinely roll forward prior to delivery, a nearly 4-to-1 paper-to-registered overhang leaves virtually zero margin for error: if geopolitical shock or Shanghai’s 7% to 11% physical premium convinces even a modest fraction of remaining longs to stand for delivery rather than roll, available registered float would face immediate strain—all while commercial solar and AI infrastructure manufacturers remain locked into inelastic procurement. Meanwhile, with the SPR sitting at a 44-year low of 279.54 million barrels, three U.S. carrier strike groups converging off Iran, and a $40.6 trillion debt wall preventing the Fed from ever applying true Taylor Rule tightening, policymakers have zero margin for error if tonight’s Gulf escalation spills into broader regional kinetic conflict.
Paper markets can suppress price discovery during periods of calm liquidity, but they cannot manufacture physical barrels of diesel or deliverable bars of silver once shipping lanes close and settlement deadlines arrive. Even Wall Street’s most conservative Q4 revision—J.P. Morgan’s slashed $63 target—quietly concedes nearly 30% upside from current levels. The gap between synthetic pricing and physical scarcity has rarely been wider, and the window for paper narratives to hold the line is rapidly closing.
This analysis is for educational purposes only and does not constitute investment advice.
© 2026 Buzzocles / CBNC. All Rights Reserved.
All reports, indices, and market analyses produced by Buzzocles for CBNC are proprietary works protected by copyright and trademark law. Media outlets and analysts may reference official figures and charts with clear attribution to “Buzzocles / CBNC (cbnc.com).” Commercial redistribution or replication of methodologies is prohibited without written permission. Content is provided for informational purposes only and does not constitute financial or investment advice.