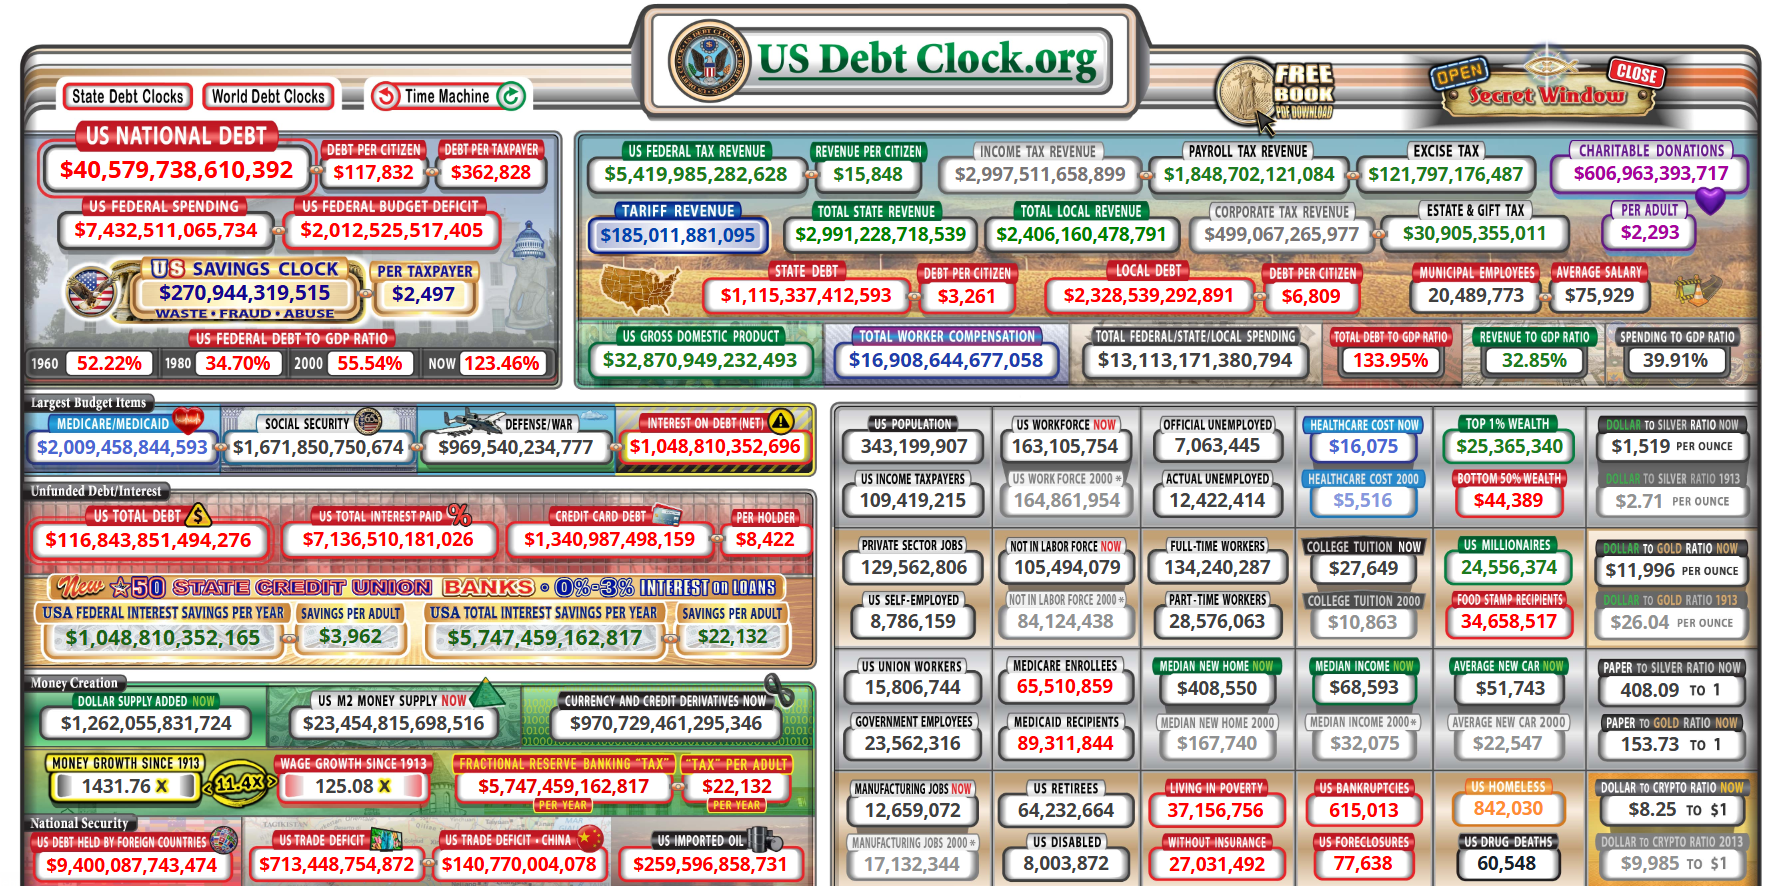
Photo Credit Screenshot USDebtClock.org
By Buzzocles
(Editor’s Note – This is a follow up to Buzzocles’ Comprehensive Analysis of Commodity Prices and the Economy. Link below – JT)
Prefix: The Commodity Conflation Fallacy
True market pricing is never the product of an isolated metric. To view silver purely through the lens of COMEX draw downs is a fundamental analytical error. Commodities operate within a synergistic matrix of geopolitical friction, monetary debasement, and physical constraints. The depletion of the Strategic Petroleum Reserve (SPR) will, alongside concurrent factors, stimulate cost-push inflation in an economy already suffocating under a $40+ trillion sovereign debt wall. It is a wall because at this level the Federal Reserve has little recourse to its traditional monetary tools. Capital may flee to preserve value, seeking perhaps to transition to silver, but in this case it will collide with an inelastic industrial floor that cannot substitute its inputs. The resulting price rise will not be caused by one variable, but by the simultaneous confluence of many.
This week’s audit discusses the profound absurdity of paper silver pricing, specifically examining the structural disconnect between the Federal Reserve’s arbitrary narrative management and the rigid physical laws governing the real economy. Over the past week, the precious metals complex endured a violent downward correction, with paper silver temporarily crashing below the $50 threshold on October 30. Mainstream commentators quickly responded to this pullback, pointing to hawkish Federal Reserve signals and accelerating U.S. inflation (3.6% annual PCE) as definitive proof of demand destruction.
Table 1: Macro Indicator Matrix (November 1, 2026 Audit)
| Variable | Magnitude (November 1, 2026 Audit) | Weekly Rate of Change | Model Impact |
| Silver Spot Price | $50.60 / troy oz | -$7.29 (Multi-week decline) | Consolidated paper price testing psychological support at $50 following an intense algorithmic liquidation shakeout. |
| COMEX Registered Float | 104.3M ounces | Stable Low Volume | Deliverable inventory remains tightly bounded near historic lows; structural vault drainage continues. |
| U.S. Strategic Petroleum Reserve (SPR) | 282.9M – 284.6M barrels | Final Draw Allocation Completed | Drained to a 44-year low (1982 floor). The final 41M barrel emergency release contracts are fully awarded |
| National Average Retail Diesel | $6.35 / gallon | +$0.14 Up from previous week, down from two weeks ago | High freight and extraction cost overhead structurally locked in across all regional transport vectors. |
| Physical Oil (Dated Brent) | $111.84 / barrel | -2.0% (48-hour election cool-off) | Short-term correction driven by temporary headline noise from Iran-Qatar diplomatic talks, masking the structural loss of the SPR buffer. |
| U.S. Sovereign Debt | $40.44 Trillion | Sustained Expansion | Public debt sits at a record high |
| Gulf Energy Disruption Index (GEDI) | 56.84 (Historic High Print) | Parabolic Acceleration | Models the 45.0x war-risk insurance premium multiplier following the Sunday evening tanker mine detonations in the strait. |
Silver, Fiscal Dominance, and the Informational Lag
The global financial architecture is currently operating under a profound informational lag, where public-facing narratives are deliberately utilized to compress sentiment and mask structural insolvency. For the analytical observer, this creates a profound opportunity: a clear divergence between institutional signaling and physical reality.
Bifurcated Postures…
The most explicit manifestation of this lag lies in the bifurcated posture of the world’s dominant bullion bank. On October 13, 2026, J.P. Morgan Global Research published a cautious commodity outlook capping late-2026 silver at a conservative $70 per ounce, citing an isolated 30% reduction in solar-application industrial demand.
Yet, warehouse audits reveal heavy physical accumulation by the bank’s accounts, amassing an estimated 195 to 210 million ounces—roughly 25% of annual global mine production. This divergence creates an informational asymmetry trap, utilizing paper narratives to suppress spot pricing and enable accumulation.
Industrial Demand
Industrial demand remains resilient due to the continuing build out of AI Centers and the electrical grid, and limits in solar panel paste reduction. Thrifting has hit a physical limit around 5 mg per watt, as noted by research from the University of New South Wales and Fraunhofer ISE. Pushing below this threshold causes high electrical resistance and localized overheating, as well as delamination risks during thermal cycles. With alternative copper methods facing degradation issues, commercial procurement remains inelastic, preventing manufacturers from thrifting further without severe product liability risks.
Debt Spirals and the GEDI
This industrial inelasticity is meeting mounting fiscal pressure. With U.S. debt at $40.44 trillion and net debt service taking 21.17% of revenues, foreign central bank bidding dropped to 52.5% while domestic banks took 30.7%. Simultaneously, the Gulf Energy Disruption Index (GEDI) sits at a critical 56.84, driving retail diesel back up to $6.35 per gallon and raising overall costs throughout the economy, including across mining operations.
Table 2: 24-Month GEDI Trajectory Log
| Reporting Period | Daily Transit Crossing Volume (Strait of Hormuz) | War Risk Insurance Premium Multiplier | Calculated GEDI Print |
| Oct 2024 (Base) | 18.5M bpd (Normal baseline) | 1.0x (Standard baseline) | 1.00 (Normalized Regime) |
| Apr 2025 | 16.2M bpd (Initial Friction) | 3.5x (Escalation premium) | 7.42 (Elevated Alert) |
| Oct 2025 | 12.1M bpd (Active Kinetic Interdiction) | 12.0x (Prohibitive parameters) | 24.80 (High Disruption) |
| Mid-Oct 2026 | 11.1M bpd (Temporary protection rebound) | 30.0x (Commercial paralysis) | 42.19 (Critical Baseline) |
| Nov 1, 2026 | 5.2M bpd (Immediate structural shutdown) | 45.0x (Terminal war-risk loading) | 56.84 (Historic High ) |
Asian Arbitrage
Eastern physical demand remains robust, with Chinese imports surging 173% above seasonal baselines to exploit a 12% to 17% premium over Western paper pricing. With the December 2026 contract showing massive open interest against limited registered float, any forced paper settlement risks decoupling physical and synthetic markets entirely.
Observations and Conclusion
The past week’s silver price crash appears to have been entirely the product of programmatic algorithmic noise rather than physical realities. High-frequency trading programs are hardcoded to react to central bank theater; when two policymakers dissented in favor of an immediate interest rate hike, automated systems aggressively liquidated paper contracts because their standard models dictate that rising real yields increase the opportunity cost of holding non-yielding metals. These models operate in complete exclusion to all other considerations, by default rendering them subjective.
The core vulnerability of these algorithmic models lies in their total blind spot toward this institutional subjectivity. While mainstream market participants treat central bank rate-setting as an objective, formulaic science, operating under the assumption that policy tightly tracks prescriptive frameworks like the Taylor Rule, the profound incredible reality is that foundational equations are casually overridden whenever they demand uncomfortable or system-ending adjustments. Think about that…
Prior to the escalation of the current Gulf War, a rigid application of the 1993 Taylor Rule prescribed a theoretical policy rate of 6.02%, yet real-world policymakers chose to maintain an arbitrary target of 3.50% to 3.75%. Under the current severe supply-side energy shock—where the Gulf Energy Disruption Index (GEDI) sits at a critical 56.84—the formula would demand a staggering 11.33% policy rate to stop inflation by crushing domestic consumer demand. Needless to say, under the present circumstances this would conjure a stagflationary nightmare.
Moreover, sustaining actual interest rates anywhere near that level is a mathematical impossibility with a $40.44 trillion national debt wall. Doing so would instantly trigger an unprecedented fiscal insolvency crisis, as net debt-servicing outlays already consume 21.17% of actual fiscal year revenues. Because the Federal Reserve is mathematically trapped, its policy adjustments are entirely decoupled from objective data, functioning purely as a mechanism of ad-hoc narrative management designed to sustain an illusion of administrative control.
And yet the reactionary paper futures market remains hyper-sensitive to these arbitrary institutional whims. A 25-basis-point shift cannot alter physics. Programmatic rate hikes cannot clear a blocked shipping lane, lower a 45x maritime insurance multiplier, or manufacture physical solar infrastructure out of a silver exchange check. This fundamental mismatch explains the immediate, robust rebound witnessed on November 1: the moment paper-driven algorithms dragged futures prices down, sophisticated institutional desks recognized the artificial discount and initiated heavy physical dip-buying. Short-term paper volatility is an administrative smokescreen; the underlying physical float remains rigidly constrained, validating the structural flight into unencumbered tangible silver outside the perimeter of the paper market.