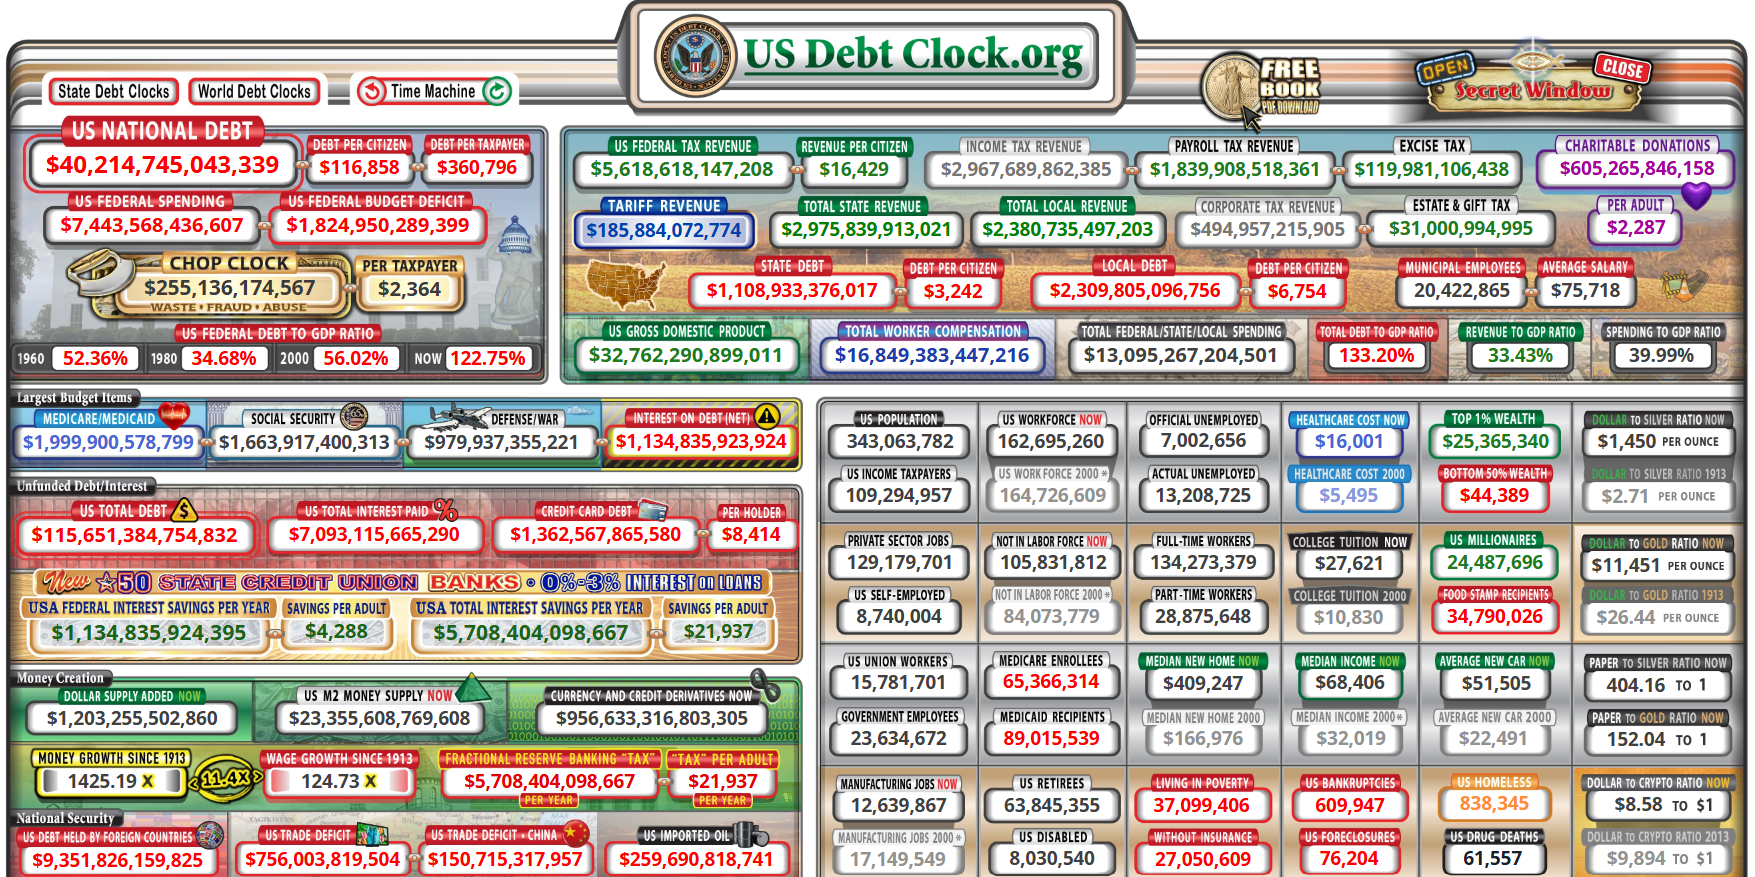
Screenshot of USDebtClock.org
Date: September 28, 2026
Prefix: The Commodity Conflation Fallacy
True market pricing is never the product of an isolated metric. To view silver purely through the lens of COMEX drawdowns is a fundamental analytical error. Commodities operate within a synergistic matrix of geopolitical friction, monetary debasement, and physical constraints. The depletion of the Strategic Petroleum Reserve (SPR) will stimulate cost-push inflation into an economy already suffocating under a $40+ trillion sovereign debt wall. Capital may flee to preserve value, seeking perhaps to transition to silver, but in this case, it will collide with an inelastic industrial floor that cannot substitute its inputs. The resulting price rise will not be caused by one variable, but by the simultaneous confluence of many.
| Macro Variable | Current Magnitude (Sep 21, 2026) | Velocity (Weekly Rate of Change) | Model Impact |
| Silver Spot Price | $62.46 / troy oz | -$3.40 (Weekly Loss) | Trading near multi-week lows. Price declined due to a stronger dollar and higher Treasuries yields. |
| COMEX Registered Float | 96.3M ounces | Constrained | Stalled below key threshold. Deliverable inventory remains under the 100M oz line, leaving paper open interest highly leveraged against physical metal. |
| U.S. Strategic Petroleum Reserve (SPR) | 284.55M barrels Next Data on 9/30/26 | -410,000 barrels(Steady Reduction week to week, low compared to previous months) | Approaching Operational Stress Levels. Official EIA Data confirms reserves are at a 44-year low. Extraction velocity is flattening as the reserve nears structural engineering constraints and statutory boundaries. |
| National Average Retail Diesel | $6.53 / Gallon | +$0.04 to $0.24, depending on data source | Historic Record Nominal High. Supply disruptions at global shipping choke points have escalated domestic distribution costs. |
| Global Crude Benchmarks (Brent) | $106.14 / Barrel | Up ~$5 due to continuing geopolitical tension | Elevated Input Pricing. Brent crude remains sustained over the $100 barrel mark, driven by regional conflicts and supply disruptions in the Middle East. |
| U.S. Sovereign Debt | $40.2 Trillion | ~$0 See Discussion | Fiscal Constraint. Gross national debt has surpassed $40T. The current live debt-to-GDP ratio stands at 126%, with annual net interest consuming a record 18.5% of total federal revenue. |
| Geopolitical Proxy (The Gulf Shipping Crisis) | Absolute Disruption | Static Lock | Supply Choke Locked. Ongoing conflict escalating. Repairs and bypass of damaged Saudi Arabian infrastructure. Vulnerability to new attacks continues. |
Discussion
Why the SPR Drawdown has Slowed
The Strategic Petroleum Reserve (SPR) drawdown is slowing down due to physical engineering limits and a strict three-layered legal framework.
Engineering Constraints
- Structural Cavern Damage: Pumping fresh water into the underground salt caverns to displace oil risks dissolving the salt walls and collapsing the structures if volumes drop below 300 million barrels.
- Reduced Extraction Speeds: Thinner layers of oil require slower flow rates to prevent pipelines from accidentally sucking up bottom brine and sludge.
Institutional Floors
- Private Contract Expirations: The Department of Energy’s emergency loan exchange program to commercial refiners is naturally winding down as scheduled.
- Congressional Mandate Barriers: Non-emergency sales used for budget balancing must legally suspend once the reserve hits critical baseline volumes.
- DoD Defense Baseline: The absolute bottom of the reserve is strictly protected for military use during warfare and cannot be used for economic or price relief without a national defense emergency.
Destruction of Saudi Infrastructure
Global energy security suffered a devastating blow last week when drone strikes from Iraq knocked Saudi Arabia’s 1,200-kilometer East-West Pipeline completely offline. The attack crippled three vital pumping stations, instantly halting the safe bypass of 4 to 5 million barrels of crude per day around the Strait of Hormuz.
With repairs expected to take five to six weeks, the fallout was immediate:
Export halt: Loadings at the Yanbu terminal stopped, putting its 35-million-barrel reserve on a strict 5- to 7-day countdown.
Crisis logistics: Saudi Arabia was forced to reroute oil through the Persian Gulf via RasTanura and utilize risky ship-to-ship transfers off Oman.
Market shock: By forcing 5% of the global crude supply back into a geopolitical crossfire, the disruption triggered surging maritime insurance premiums and immediate downstream inflationary shocks.
Since then the situation has improved somewhat
Saudi Aramco has successfully bypassed the heavily damaged areas and restarted crude oil flows through the pipeline. Initial pumping resumed on September 22, 2026, which allowed crude exports to start up again from the Red Sea port of Yanbu.
However, the system is not yet fully repaired. While the rerouting has allowed oil to move again, operations remain below peak performance:
Current Capacity vs. Full Recovery: Pumping resumed at a lower rate, with Aramco working to scale flows back up to around 4 million barrels per day. Restoring the pipeline back to its full pre-attack capacity is expected to take anywhere from six to eight weeks while permanent repairs are made to the charred pumping stations.
Supply Impacts: Because the pipeline has been operating at limited capacity, Aramco had to temporarily cancel some crude deliveries to European refiners and offset disruptions by increasing alternative tanker loadings out of the Persian Gulf.
The Saudis have used a bypass strategy to rapidly get oil moving again—but completely fixing the infrastructure will still take several more weeks, assuming they are allowed to do so unimpeded.
Capital Flight Signals: The Treasury Auction Failure
The events of the past week represent an exacerbation of this aspect of the situation. Last week’s write up focused heavily on the 20-Year U.S. Treasury Auction failure. However, the past 4 to 5 days have brought a massive wave of escalating market signals:
The Federal Reserve’s Rate Hike: The Fed raised interest rates for the first time in three years.
The Multi-Maturity Auction Contagion: The structural failure bled violently into shorter-duration debt. The $70 billion 5-Year note auction on September 23 tailed aggressively, clearing at a staggering 5.033% (the highest since 2006) with dismal demand indicators (Indirect Bidders plunged to 54%). The 7-Year Note auction similarly collapsed to a 33-year high yield.
Desperate Treasury Intervention: The sell-off intensified to the point that Treasury Secretary Scott Bessent had to deploy emergency long-end liquidity maneuvers. The Treasury tripled its buyback operation to actively purchase up to $6 billion in older, illiquid long-dated bonds. Despite this emergency intervention, the sell-off deepened, sending the 10-year yield skyrocketing to 5.20% and the 30-year yield breaching 5.50%—its highest level since 2004.
Deep Dive: The Cross-Curve Auction Cascade
The deterioration of sovereign credit demand is no longer confined to the 20-year technical tail. A structural buyer strike has rapidly paralyzed shorter, heavily supply-weighted tenors:
The 5-Year Collapse: On September 23, the Treasury attempted to push $70 billion in 5-year notes into a fading market. The auction failed catastrophically, tailing violently to clear at 5.033%—the highest yield since 2006. Global central banks and offshore accounts (Indirect Bidders) collapsed from their 65% baseline to a meager 54%, exposing a severe global retreat from U.S. paper.
The 7-Year Exhaustion: Days later, the 7-year note auction replicated this failure, clearing at a 33-year high yield as market depth evaporated.
Failure of Emergency Intervention
The severity of this systemic breakdown is explicitly measured by the failure of emergency state-sponsored stabilization. In a desperate bid to preserve secondary market functioning, the Department of the Treasury deployed expanded liquidity-support buybacks, tripling operations to accept $4.078 billion in long-end paper.
The market’s response was a definitive rejection. Rather than stabilizing, the sell-off aggressively intensified. The benchmark 10-year yield surged to 5.20% (a 19-year high) and the 30-year yield breached 5.50% (a 22-year high), proving that administrative backstops can no longer neutralize the compounding weight of structural oversupply.
The Systemic Banking Bottleneck
With international capital fleeing intermediate and long-dated U.S. debt, domestic primary dealers are experiencing an acute capital-absorption crisis. Forcing domestic balance sheets to warehouse tens of billions in unabsorbed, rapidly depreciating Treasuries creates a severe, compounding liquidity drain. This structural bottleneck fundamentally impairs the private sector, starving commercial lending pipelines of liquidity just as a hawkish Federal Reserve escalates borrowing costs.
Implications for Our Core Thesis
The developments of the past week provide undeniable, empirical validation for the foundational premise of The Commodity Conflation Fallacy, which we open each Sunday Audit edition with.
This is no longer a theoretical debate regarding real interest rate insolvency. When the U.S. Treasury must dedicate 23% of all federal revenue ($1.27 trillion) exclusively to servicing the interest on its $40 trillion debt wall, the math governing fiat duration breaks down completely. The failure of aggressive Treasury buybacks to arrest the surge in real yields reveals that the domestic private market is rapidly approaching its absolute saturation capacity.
As the private curve rejects this supply, the system moves inexorably toward its structural breaking point. The Federal Reserve is trapped: it must either watch the sovereign curve experience a disorderly collapse, or step in as the structural buyer of last resort—initiating an unbacked monetary expansion to clear the market. This sequence permanently cements the primary macro risk as systematic currency debasement, driving smart, non-fiat capital directly out of financialized instruments and into hard, real assets with inelastic industrial utility, e.g., silver.
Implications of the Week and the Modified Taylor Rule
As we detailed in: https://cbnc.com/are-the-iranians-trolling-the-fed-ghalibaf-taylor-rule-a-serious-joke/ last week, Iranian Parliament Speaker Mohammad BagherGhalibaf’s modified Taylor Rule equation introduces explicit coefficients for maritime chokepoints like the Strait of Hormuz, serving as a valid predictive model for how physical supply shocks would force a destabilizing monetary response from the Federal Reserve, or abandonment of the FED’s own rule of thumb due to infeasibility, thus confirming the trap the US and FED are in due to resulting petroleum price increases.
Mainstream financial institutions blindly dismiss this relationship as mere political satire, ignoring how an asymmetric physical bottleneck exposes the central bank’s structural dilemma—a limitation implicitly verified by Fed Chair Kevin Warsh’s admission that supply-driven commodity adjustments are entirely beyond central bank control. This institutional blind spot underscores a fundamental policy trap that ultimately validates a bullish macroeconomic thesis for silver as an essential hard-asset hedge against systemic currency debasement.
The Federal Reserve cannot choose the mathematical prescription of the Taylor Rule because doing so triggers an immediate, disorderly collapse of the United States government’s balance sheet. Therefore, the Fed’s policy response is entirely predictable:
- They will be forced to capitulate to the inflation.
- They will eventually be forced to cut interest rates and deploy emergency quantitative easing (printing money) to buy the failing Treasuries.
This step caps nominal bond yields, saving the Treasury from nominal default, but it completely wrecks inflation expectations.
By proving that the Fed’s own rules demand an interest rate that the U.S. debt structure cannot physically survive, the Rule demonstrates that systematic currency debasement is the only path of political least resistance. This structural certainty is what drives smart capital entirely out of paper assets and into inelastic, industrially vital hard assets like silver, which cannot be printed by a trapped central bank.
Final Note
The following is a condensation of a weekend report from the Hal Turner website. The developments described are consistent with specific observations of this week’s Sunday Audit, with implications for geopolitical stability, oil pricing, and concomitant macroeconomic effects.https://halturnerradioshow.com/index.php/news-selections/world-news/explosions-in-sirik-iran-and-in-strait-of-hormuz-reports-of-naval-battle
SUMMARY:The Strait of Hormuz experienced a major military escalation on Saturday night as Iran’s IRGC launched a wave of anti-ship cruise missiles and drones against a large U.S. Navy escort attempting to transit an oil shipment through the waterway. Multiple missile impacts on vessels were reported near Qeshm and Larak Islands, significantly heightening the risk of an impending U.S. military escalation.
(The Buzzocles Report recommends subscribing ($3/month) for full access to Turner’s reports since they tend to provide information at least 24 hours ahead of other sources, and in some cases information that never makes it to the mainstream press.)