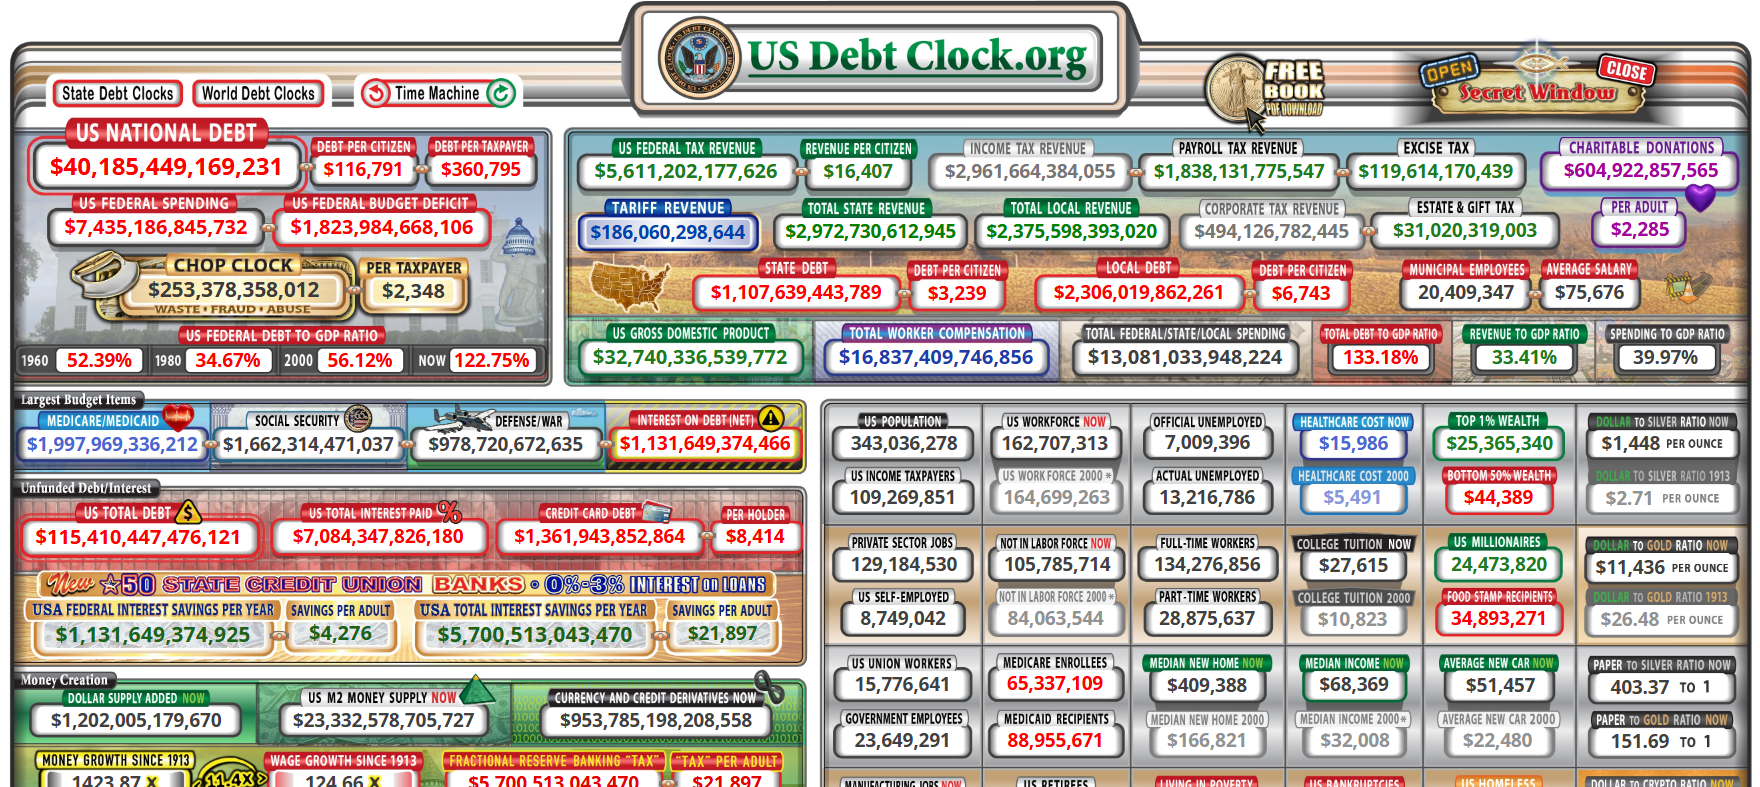
Screenshot of usdebtclock.org
Date: September 21, 2026
Prefix: The Commodity Conflation Fallacy
True market pricing is never the product of an isolated metric. To view silver purely through the lens of COMEX drawdowns is a fundamental analytical error. Commodities operate within a synergistic matrix of geopolitical friction, monetary debasement, and physical constraints. The depletion of the Strategic Petroleum Reserve (SPR) will stimulate cost-push inflation into an economy already suffocating under a $40+ trillion sovereign debt wall. Capital may flee to preserve value, seeking perhaps to transition to silver, but in this case, it will collide with an inelastic industrial floor that cannot substitute its inputs. The resulting price rise will not be caused by one variable, but by the simultaneous confluence of many.
| Macro Variable | Current Magnitude (Sep 21, 2026) | Velocity (Weekly Rate of Change) | Model Impact |
| Silver Spot Price | $66.65 / troy oz | +$3.14 (Weekly Gain) | Trading near multi-week highs. Price advanced following the Federal Reserve’s 25bps interest rate hike on Wednesday. |
| COMEX Registered Float | 97.3M ounces | Constrained | Stalled below key threshold. Deliverable inventory remains under the 100M oz line, leaving paper open interest highly leveraged against physical metal. |
| U.S. Strategic Petroleum Reserve (SPR) | 284.96M barrels Next Data on 9/23 | -403,000 barrels (Deceleration) | Approaching Operational Stress Levels. Official EIA Data confirms reserves are at a 44-year low. Extraction velocity is flattening as the reserve nears structural engineering constraints and statutory boundaries. |
| National Average Retail Diesel | $6.49 / Gallon | +$0.29 | Historic Record Nominal High. Supply disruptions at global shipping choke points have escalated domestic distribution costs. |
| Global Crude Benchmarks (Brent) | $101.3 / Barrel | Consolidating | Elevated Input Pricing. Brent crude remains sustained over the $100 barrel mark, driven by regional conflicts and supply disruptions in the Middle East. |
| U.S. Sovereign Debt | $40.2 Trillion | +$15B / Week | Fiscal Constraint. Gross national debt has surpassed $40T. The current live debt-to-GDP ratio stands at 126%, with annual net interest consuming a record 18.5% of total federal revenue. |
| Geopolitical Proxy (The Gulf Shipping Crisis) | Absolute Disruption | Static Lock | Supply Choke Locked. Ongoing conflict escalating. Destruction ofSaudi Arabian infrastructure. |
Discussion
Why the SPR Drawdown is Slowing
The critical adjustment to the multi-variable model is the severe deceleration of the SPR draw rate, which has dropped to 403,000 barrels for the latest reporting week. This slowdown is driven by a combination of physical engineering limits and a distinct three-layered legal framework:
The Engineering Constraints
- Structural Cavern Damage: The SPR stores crude in deep underground salt caverns. Displacing oil requires pumping in fresh water. Dropping below the 300 million barrel threshold means repeated water injections dissolve the salt walls, thinning the critical pillars and risking structural collapse.
- Reduced Extraction Speeds: As the physical layer of oil thins at the top of the caverns, drawdown flow rates must be structurally throttled. This mechanical reduction is required to prevent suction vortices from drawing up bottom brine and sludge into the delivery pipelines.
The Three-Layered Institutional Floors
1. Private Exchange Contract Completions: The Department of Energy’s emergency loan exchange program—which loaned up to 172 million barrels to commercial refiners during the initial shipping crisis—is naturally concluding. Physical deliveries under these private contracts peaked in May and have systematically hit their scheduled expiration dates over the summer.
2. The Congressional Mandate Barrier: While Congress frequently uses non-emergency SPR sales to balance unrelated budgetary items, statutory triggers dictate that these non-emergency mandates must be legally suspended once the reserve drops below critical volume baselines. The reserve is currently converging on this legislative line.
3. The DoD Absolute Defense Baseline: The ultimate bottom of the SPR consists of the Department of Defense Contingency Inventory. Reserved strictly to guarantee fuel availability for the military during a prolonged warfare scenario, this volume cannot legally be deployed by the Executive branch for commercial price-stabilization or economic relief without a full-scale national defense emergency declaration.
Destruction of Saudi Infrastructure
The strategic buffer for global oil logistics has collapsed following drone strikes originating from Iraq on September 10–11. Satellite imagery confirms severe fire and structural damage across three pumping stations along Saudi Arabia’s 1,200 km East-West Crude Oil Pipeline.
The Loss of Optionality: This critical pipeline was the primary mechanism used to bypass the blocked Strait of Hormuz by diverting 4 to 5 million barrels per day (bpd) to the Red Sea port of Yanbu. With the pipeline offline for a projected 5 to 6 weeks for physical repairs, the kingdom has lost its principal alternative export route.
Yanbu Port Suspension: Loadings at Yanbu have been completely suspended. While the port holds a 35-million-barrel storage capacity, these localized stocks are sufficient to maintain baseline commitments for only 5 to 7 days before running completely dry.
The Transit Shift: To compensate, Saudi Arabia has resorted to a high-friction shuttling operation. Oil must be loaded inside the Persian Gulf at Ras Tanura, transported directly through the highly volatile Strait of Hormuz, and transferred via ship-to-ship operations off Sohar, Oman, to long-haul tankers.
This infrastructure failure embeds permanent maritime transport and insurance risk premiums into the system. By removing 4% to 5% of global oil supply from low-risk transit corridors, energy costs are tracking actual global supply disruptions, transferring the cost-push impact directly to domestic distribution networks.
Capital Flight Signals: The Treasury Auction Failure
The mechanical trap of the $40+ trillion sovereign debt wall manifested explicitly in the recent 20-Year U.S. Treasury Auction results. The auction cleared with a significant technical “tail,” serving as a direct market signal of deteriorating sovereign credit demand:
Foreign Flight Baseline: Foreign central banks and international institutions (Indirect Bidders) absorbed only 52.5% of the total issuance, marking the lowest foreign allocation metrics on record for this duration. This indicates that sophisticated offshore capital is pricing in long-term dollar devaluation and real-yield erosion, choosing to limit exposure to long-dated U.S. sovereign debt.
The Domestic Banking Trap: To absorb the remaining debt allocation, domestic primary dealers and commercial banks (Direct Bidders) took a record 30.7% of the auction. This domestic concentration creates a severe systemic bottleneck; forcing the domestic banking system to continuously absorb multi-billion dollar treasury allocations systematically drains liquidity from commercial lending pipelines.
Core Thesis Integration
This auction failure directly validates the foundational premise of The Commodity Conflation Fallacy. When the smartest, risk-managed pools of global capital refuse to absorb long-term paper debt at a 5.42% yield due to real interest rate insolvency, the underlying system shifts toward its structural breaking point. As the domestic market hits its absolute saturation capacity for government debt, the Federal Reserve is left as the structural buyer of last resort—forcing monetary expansion to artificially clear the market. This specific sequence shifts the primary risk from a standard market correction to systematic currency debasement, driving capital directly toward real assets with inelastic industrial utility, precisely matching the structural case for silver.
Asymmetric Monetary Triggers: The Modified Taylor Rule
A fascinating development supporting the silver pricing thesis emerged following the publication of a modified Taylor Rule equation by Iranian Parliament Speaker Mohammad Bagher Ghalibaf. The mathematical revision introduces explicit coefficients tracking physical constraints at global maritime choke points—specifically the Strait of Hormuz (SOH) and Bab el-Mandeb (BEM):
The Predictive Functionality: This modified equation does not represent an administrative claim that external actors are directly dictating U.S. base rates. Instead, it serves as a valid predictive model demonstrating how localized maritime closures fundamentally dictate U.S. central bank parameters.
Systemic Oversight: Mainstream global financial institutions and media networks have universally categorized this mathematical relationship as political satire or an online rhetorical provocation designed for “agitprop.” By framing the equation as a superficial stunt, institutional analysis completely ignores how an asymmetric physical shock mechanically forces a destabilizing monetary response from the central bank. This institutional blind spot persists despite implicit verification from Federal Reserve Chair Kevin Warsh, who conceded in his post-meeting press conference that supply-driven commodity price adjustments remain entirely beyond central bank control, confirming the structural dilemma modeled by the formula.
For a more detailed analysis of the Ghalibaf post go to: https://cbnc.com/are-the-iranians-trolling-the-fed-ghalibaf-taylor-rule-a-serious-joke/
Continuing last Sunday’s Discussion: Why isn’t big institutional money buying physical silver right now?
As noted in the previous report, for a corporate fund manager, losing money safely within the herd is better than risking their career to be right alone. If a manager follows the herd and loses 20%, they keep their job because “everyone lost money”; if they buy physical silver and it experiences a short-term 8% drop due to paper volatility, they risk getting fired for speculative negligence.
This creates a systemic blind spot. Wall Street relies on digital liquidity, operating under the illogical premise that a paper claim guarantees physical availability—a delusion that will persist right up until the breaking point.
But there is more to it than this. The fact is, the above articulated dynamic aside, big institutional money is buying physical silver now, and has been for a while.
From “Slow Drain” to “Smart Money Sprint”
The market has evolved through two distinct phases, often misread by the public and in silver discussions carried on the internet.
Phase 1: The Slow Drain (2021–2024)
Driver: Industrial Demand (Solar, EV, Electronics).
Nature: A steady, “normal” drawdown of inventory to meet real-world manufacturing needs.
Public Perception: Viewed as a “market tightness” issue.
Result: 762 million ounces drawn from above-ground stocks over six years.
Phase 2: The Abrupt Sprint (Late 2025–Early 2026)
Driver: Smart Money Realization. Institutions (Sprott, JP Morgan, Sovereign Funds) recognized the physical shortage was imminent and the paper market was about to break.
Nature: A non-linear, rapid acceleration of buying.
Key Evidence:
COMEX Registered Inventory: Down ~75% from 2020 peaks (RealClearMarkets).
Delivery Notices: JP Morgan issued 8.1M oz in a single day (Jan 2026).
Capital Raises: Sprott doubled its program to $2B to buy 18M oz (16% of all registered inventory).
China Premiums: Trading at 12-13% over spot, signaling a physical shortage not reflected in paper prices.
The basic answer is that the ‘slow drain” was simply industrial consumption, but the 75% drop is the signal that the “Smart Money” is front-running the crash.
Following is the more in-depth analysis
The institutional accumulation did not actually slow down between February and today [Sprott Asset Management / London Bullion Market Association (LBMA) Reports]. Instead, it went underground, shifting from aggressive visible buying to stealthy operational mechanisms [Over-the-Counter (OTC) Market Data / Metal Focus Analysis]. The drop from the vertical $121.67 peak in January 2026 down to the current $66.65 range is completely misleading if you look at it as a sign of “waning demand” [Kitco Market Analytics]. Paper prices are behaving exactly as they always do during a margin-enforced consolidation, while the physical availability of silver is tighter than it was during the January squeeze [CME Group / Silver Institute Reports].
Why the Accumulation “Disappeared” (Feb – Sept)
The smart money did not stop accumulating; the nature of their tracking altered [Sprott Physical Silver Trust Insights].
The Exchange Margin Wall: When silver hit its nominal historic high of $121.67 on January 29, the COMEX and other major exchanges aggressively raised margin requirements—mirroring the emergency regulatory actions of 1980 and 2011 [CME Group Historical Margin Adjustments Notice]. This forced leveraged paper specs to liquidate their contracts immediately, intentionally breaking the parabolic price momentum [CFTC Commitments of Traders Report].
Off-Exchange Diversion: Institutions learned that buying massive blocks directly on the COMEX draws intense regulatory and public eyes [Wall Street Journal Commodities Desk]. Instead, accumulators heavily shifted their volume to Over-The-Counter (OTC) private markets and London LBMA unallocated conversions [LBMA Clearing & Vaulting Statistics].
The Silent Base Reclassification: If you look closely at warehouse data, the rapid free-fall of physical stocks stabilized into a tight defensive band [CME Group / COMEX Daily Warehouse Reports]. In February, COMEX registered stocks briefly bottomed out near 88.4 million ounces [CME Group Delivery Archives]. Today, they sit at 97.3 million ounces [CME Group Warehouse Stock Report]. That minor increase wasn’t new mining supply; it was entities converting privately held “Eligible” silver into “Registered” status solely to satisfy delivery commitments and prevent an absolute exchange failure [RealClearMarkets Commodities Review].
Why $66 Spot Does Not Reflect True Availability
The current spot price is purely a reflection of paper derivative balancing, not physical reality [CPM Group Silver Yearbook]. Physical market tightness can be tracked via indicators that paper short sellers cannot manipulate:
Sustained Structural Deficits: The broader silver market is currently navigating its sixth consecutive year of a severe structural supply deficit [Silver Institute / Metals Focus World Silver Survey]. Industrial demand (driven by solar photovoltaics and defense electronics) consumes more physical silver than global mines produce annually [International Energy Agency (IEA) PV Tracker].
High Eastern Premiums: Even with global spot at $66, physical silver trading on the Shanghai Gold Exchange (SGE) has consistently commanded 12% to 13% premiums over western paper prices all summer [Shanghai Gold Exchange Premium Index / Bloomberg Commodities]. Physical metal is being pulled continuously from West to East because the paper market refuses to price it accurately [Reuters Commodities Desk].
The Lease Rate Metric: Physical scarcity is best observed through silver lease rates, which temporarily spiked over 30x their historical averages during supply pinches this year [London Bullion Market Association (LBMA) Forward / Lease Rate Boards]. If silver were abundant, institutions would not be paying historic premiums just to borrow physical bars for short-term industrial obligations [LBMA / BullionVault Analyst Notes].
The Takeaway
The consolidation between $60 and $72 since the crash is a classic “falling wedge” accumulation pattern on an institutional scale [TradingView Market Technical Analysis]. The smart money is using the artificial, margin-depressed $66 paper price to absorb physical metal ahead of the next structural delivery crunch [Sprott Insights].